Practice Plotting

Load packages
using JLD
using DataFrames
using StatsPlots
using TimeSeries
Plots is a convenient Julia package which allows to use the same code with many graphing backends such as the GR framework (great for speed), Plotly.js (allows interaction with your graphs in a browser), or PyPlot. StatsPlots is an enhanced version with added stats functionality.
For this course, we will use the GR framework:
gr()Load our data frame
Let's start by loading our data frame from the previous lesson thanks to the JLD package (of course, use the path to the covid.jld file in your system):
datlong = load("../../data/covid.jld", "confirmed")World plot
Let's start by plotting a world summary of confirmed Covid-19 cases over time.
For this, we need the sum of confirmed cases for each day. So we group the data by date (: in :date means that date is a Symbol ).
Then we combine the data within each group by making the sum of the confirmed values and we call our total confsum .
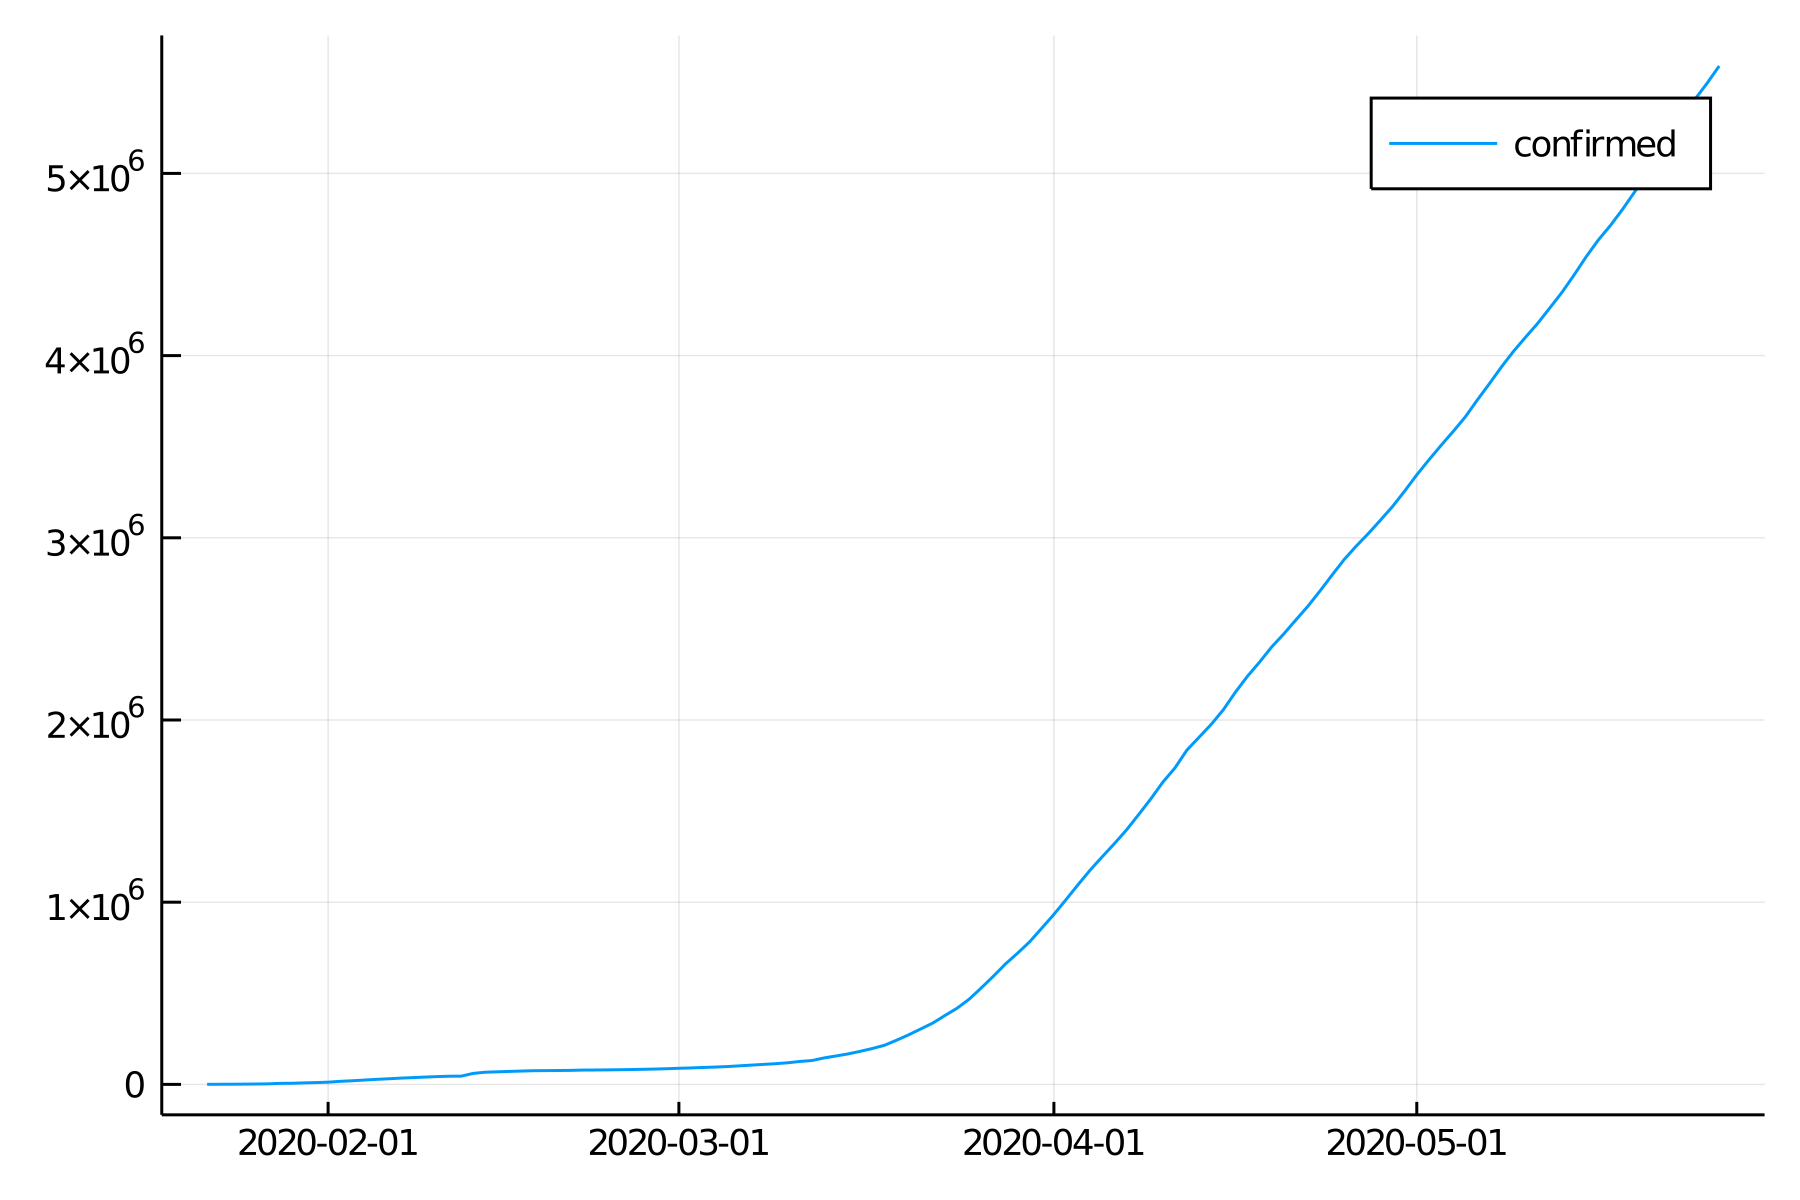
world = combine(groupby(datlong, :date), :confirmed => sum => :confsum)Since our data is a time series, we need to transform the data frame world we just created to a TimeArray thanks to the TimeArray function from the TimeSeries package. Then we can plot it by passing it to the function plot :
plot(TimeArray(df1, timestamp = :date))

That worked, but our graph is not exactly pretty.
Looking at the documentation for the plot and subplot attributes of the Plots package (StatsPlots works the same way since it is the same package with more tools), try to customize and improve this graph.
For instance, maybe you could give it a title, a better legend, a legend in a better position…
Backends
I mentioned earlier that Plots /StatsPlots (remember that StatsPlots is Plots with added functionality) does not itself plot but that it uses backends and is a really convenient way to run the same code on many different APIs. We will give this a try in the next section.
But first, a few notes on Plots backends:
- Some of the plotting backends (GR and Plotly ) don't need to be explicitly installed as they are installed as dependencies of Plots (Plots would not work if it had no backend!) This is why we could run gr() to chose the GR backend while we never explicitly installed the GR package.
- When you run ] status , you won't see GR in the list (even though it is installed and you can use it: Pkg.status only lists packages that you have explicitly installed, not the dependencies. If you ran ] add GR , then you would see it in the list (but there is no reason to do that).
- The other backends need to be installed before they can be used (it wouldn't make sense to have all these different options installed by default).
- The Plots documentation gives some advise as to which backend to choose.
- You don't need to load the backends with using (you would do this if you were using them directly, without using Plots ): you select them as backend with the functions gr , plotly , etc.
- If you don't run the code to set the backend (e.g. gr() ), Plots will default to whatever backend is available on your machine (usually it defaults to GR ).
UnicodePlots
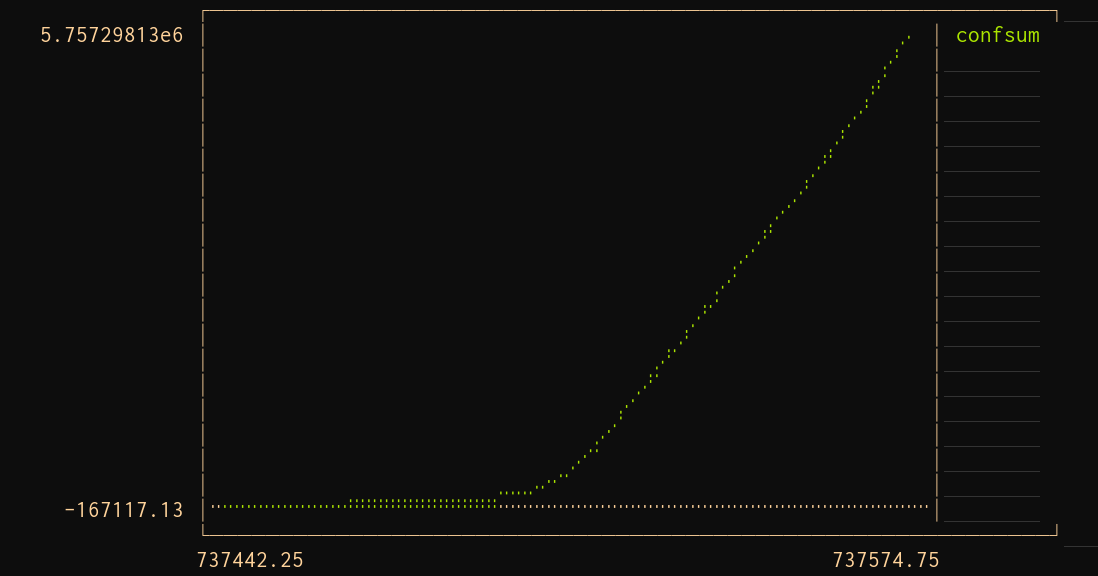
UnicodePlots plots in the terminal. As you can imagine, this does not produce the kind of graphs you want in your next paper. But it can be extremely convenient to be able to plot directly in the terminal, without using a graphical interface. A great place where this could be very useful is when you are running interactive jobs on the cluster with salloc .
So, let's see if our code works as planned on UnicodePlots :
unicodeplots()

plot(TimeArray(world, timestamp = :date))

That worked. The same code ran on a different API. That's the whole idea of Plots .
Countries plot
Now, we want to plot the data for some countries.
Try to group the data by country, index the countries of your choice, and plot the number of confirmed Covid-19 cases over time for these countries.